A quick refresher on our survey
As noted last year, since the number of pricing-related articles on this blog is starting to become unwieldy, we set up a single page of Digital Signage Cost Estimates and Price Guidelines for those who want to review past years' results or measure historical trends for themselves.
Since digital signage networks can take so many different forms, we try to focus on what still makes up the most typical installation, and build price estimates as if one were planning to deploy a 100-screen network (that is, one screen in 100 different venues). Along those lines, here's some background information that we've mentioned during the last few pricing studies:
While our previous cost estimates and ecosystem components have closely matched those from other industry analysts (so we don't think we're too far off the mark), the myth of a "typical" network is more strained this year than ever before. More vendors and network owners are choosing to implement screens with new formats and more varied locations, injecting more diversity into the projects. Plus, the idea that there's a standard staffing requirement for any digital signage network is pretty ridiculous. While we and others have proposed a list of key positions that need to be filled when creating a digital signage team, some networks are still very heavy on content production, while others might be composed almost entirely of sales folks. Still, as we looked across a wide array of networks -- representing not just our products but also our competitors' solutions -- we were able to get a reasonable feel for what most companies needed as far as the human resources side of things.What's the cost of a typical 100-screen digital signage network?
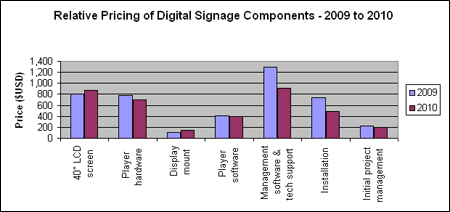
Last year's recession likely played a large part in the massive price drops we noted across the industry, but this year's stabilization paints a slightly different picture. While media player pricing continued to fall according to the long-term curve, prices for screens and mounts actually increased a bit, probably in part to correct the overcompensation that happened in 2008 and 2009. Media player software pricing held relatively steady, but technical services took a beating, falling by more than 30% in some select cases. Meanwhile, automation and offshoring have made other service components less expensive, but real salaries have increased a bit this year as well, causing the overall staff-related costs to rise.
The resulting cost estimates appear in the table below. (If you're viewing this in your email or RSS reader and can't see the tables and charts, we encourage you to visit /blog to get the full experience.)
| Cost of a digital sign for 3 years | |
| 40" LCD screen | $875 |
| Player hardware | $700 |
| Display mount | $140 |
| Player software | $400 |
| Management software & tech support | $915 |
| Installation | $490 |
| Initial project management | $200 |
| Total | $3,720 |
Again, each item is priced as if you were going to buy 100 of them to build out a network of 100 screens in 100 venues. It stands to reason that prices for smaller quantities could be substantially higher, but I didn't go to any lengths to research that.
How have things changed since our last pricing study?
In short, they haven't changed much. Case in point: this is what we wrote about last year's results:
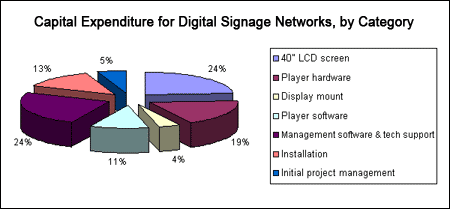
Right off the bat, you can see the dramatic decline in pricing, which we attribute to the confluence of a few things. First, and most obviously, the broad macroeconomic trends that we've all been experiencing the last 12 months or so have made ours an even more dog-eat-dog world than usual. With slower than normal deal flow and a more cautious customer base, many providers have felt compelled to slash prices in order to keep the deals moving. Stemming from this, several of the better-known vendors in our industry have experienced some pain (e.g. running out of working capital, having major investors withhold cash payments, trying to get bought/sold, etc.), and have consequently tried some... um... creative pricing strategies in an attempt to keep their heads above water. And finally, the tireless march of progress (aided by low or negative inflation rates) has simply made some of this stuff cheaper, as it almost always does.While in past years we focused on how hardware commoditization left a bigger piece of the pie available for software and services, this year's hardware stabilization and services decline reverses that trend. Hardware now accounts for just under half of the total spend, with software and services making up the rest:

Since the overall cost figure has decreased, the total amount spent on hardware is nearly the same as last year, even though its slice of the pie has actually grown.
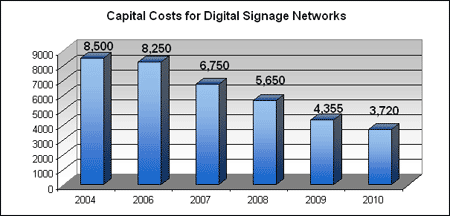
As you can see in the tables below, the cost of implementing a 100-screen network has dropped more than 14% since last year's survey. When combined with the impressive decreases we've seen over the past few years, costs have fallen more than 56% since we started tracking the market back in 2004. (Note: to ensure an accurate comparison, we removed the 24/7 tech support line from the 2004 numbers, since this was not included in subsequent years.)


What about personnel costs?
As noted, the table above is a composite estimate for running a 100-screen network over the course of 3 years. After noting last year that the "average" 100-screen network takes somewhere between 7 and 15 people to run, we updated our average salary for these personnel to $52.5K, reflecting an across-the-board increase of 5%. With the average headcount left at 9 people (which is unchanged from last year), annual personnel costs for the network are now approximately $472,500, which consequently adds about $1.42M to the cost of managing the network over our 3-year planning horizon. That's equivalent to $39,375/month in expenses, or $394/screen/month. When added to the $103/month in capital expenses, the "average" screen in a "typical" 100-screen network costs about $497/month after salaries are factored in -- which is virtually identical to our cost estimate from 2009. In other words, a 100-screen network would need to earn just under $50,000/month to break even.
What about content and financing costs?
Two areas that we continually get asked about are content creation and equipment financing. While we didn't go into great depth trying to ascertain the cost of these things in our survey, our general experience with the industry is that costs haven't moved very much over the past 12 months. More large networks are turning to equipment leasing and financing companies to reduce their initial capital outlays. While this can certainly go a long way toward keeping cash in the bank during the critical startup phase, it can also add as much as 25% or more to your costs when all is said and done. For instance, if you were to finance 100% of the $3,720 in equipment costs over 36 months at a 15% interest rate, each screen would have to earn an additional $26/month to offset those finance charges. That number may not seem unsurmountable, but it can certainly cause problems with your otherwise profitable network if you don't account for the finance charges at the outset. Financing can be a useful tool, but make sure you understand the total costs of what you're signing up for.
With regard to content, the salary increases we detected for business and sales folks didn't seem to translate over to content producers. We're thus inclined to think that the average cost of producing a spot is about the same as it was last year. However, there are a lot of new tools on the market that merge syndicated content feeds and PowerPoint-like templates, giving low-end and midrange digital signage managers sufficient tools to build mediocre content on the cheap. As these tools get better and more competitors enter the space, costs will continue to decline, while the quality of the overall content production increases.
Conclusions and caveats
First the caveats, of which there are two worth noting: One, over 50% of our survey respondents were product/service providers. Consequently, there's always the possibility that the prices that have shown up reflect their own wishes. In the past, we've found that our estimates are pretty close to other industry benchmarks, and I have no reason to suspect that the makeup of this year's survey is much different than those of the past, but you never know. And two, in the past I've been able to send emails and make phone calls and get responses from a good 30 or so network operators. This year, I cast a wide net and tried to contact about 70. I got 11 responses, only 7 of which yielded useful information. It could be that people are working harder than ever now and just don't have the time to spare. Or it could be that nobody is interested in compiling this data anymore. But it does mean I had to rely more on our survey responses and my own snooping around, which could also have affected the validity of the data.
I don't normally conclude these articles with big, sweeping introspections, since the numbers tend to speak for themselves. As detailed above, it costs pretty much the same to run a 100-screen digital signage network in 2010 as it did in 2009. While that may not seem very revolutionary, it is in fact the first time in many years that costs were stable over a 12-month period. That may be good news for buyers who were fearful of massive price drops right as they pulled the trigger on their capital purchases. Suppliers, on the other hand, are going to have to do some serious thinking about how to drive growth in the coming months and years. I suspect the unorthodox thinkers will win the day.
Have costs plateaued because the supply and demand curves have finally crossed? Or, are we witnessing the calm before the storm, as a new wave of digital signage technologies and implementations come to the fore? Leave a comment and let us know!

 Subscribe to the Digital Signage Insider RSS feed
Comments
RSS feed for comments to this post