A few assumptions
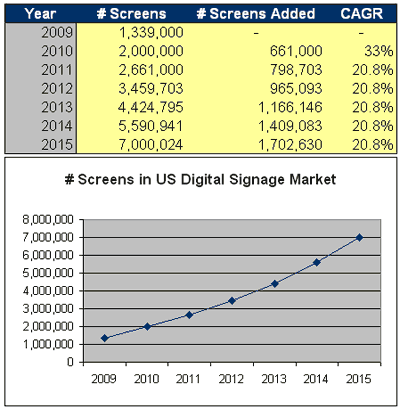
To begin with, we need to make some assumptions. First, Edson quoted some research about the growth of the digital signage industry, but didn't mention the growth rate. Consequently, we don't know if the US market will expand by 325,000 screens this year and grow geometrically, or whether it will expand by a million screens this year and grow linearly. As you'll see below, if you do some very elementary curve-fitting, we can make the numbers work out by assuming a compound annual growth rate of 21% for the next 5 years.
Next, Edson's quote about another 5 million screens refers specifically to the US market, but the IMS data is for the whole world. Ideally, we'd be working with all-US or all-global numbers. But without shelling out thousands of dollars for all these research reports, we're restricted to only the few morsels that each firm is willing to drop into their executive summaries or press releases. Unfortunately, I've been having a hard time finding public figures for the share of the digital signage market commanded by the US, so this is going to be a bit of a fudge. The best method I've been able to come up with is to use PQ Media's numbers on DOOH networks as a proxy. PQ's recent report indicated that global DOOH revenues hit $6.47 billion in 2010, while US DOOH operator revenue grew to $2.07 billion in that year. If we assume that DOOH revenues are proportional to industry growth as a whole (doubtful, but close enough for our purposes), that would mean that the US accounts for about 32% of the global market.
Caveats, and more caveats
As if the above assumptions weren't ugly enough, the total amount of revenue our industry produces is a matter of much debate, even amongst hoity-toity research firms. While IMS suggests that the global market for digital signage infrastructure was $5 billion in 2010, a rival study by ABI Research suggested the figure is closer to $1.3 billion. Interestingly, that's an upward revision on their part, since ABI's older research predicted a $641 million market in 2008 that would grow to nearly $1.4 billion by 2013. Still other research indicates a 2009 estimated market size of $3.9 billion and 1.1 million displays sold. Likewise, IMS's projection of $7 billion in infrastructure by 2013 seems almost outlandish compared to ABI's forecast of $4.5 billion in 2016. The firms are almost certainly measuring different things in different ways. Both are likely subject to different biases and will introduce different error factors based on how they collected their data, who from, and what calculations they then applied.
Let's do some math!
The above tells us that (a) even among professional researchers, there's a lot of uncertainty surrounding our industry, and (b) differences in definitions and methodologies make apples-to-apples comparisons and extrapolations all but impossible. That being said, I'm 600 words into this blog article and I'll be damned if it ends without doing at least a little questionable conjecturing based on an unsound foundation of baseless assumptions and presuppositions. Thus, based on the above research reports, we can infer the following:
- According to IMS, the global market for digital signage infrastructure was $5 billion in 2010.
- Based on extrapolation from PQ Media's DOOH report, the US accounts for about 32% of the market.
- Therefore, the US market for digital signage infrastructure was in the ballpark of $1.6 billion in 2010.
- According to WireSpring's pricing research, the "average" cost of digital signage infrastructure for a single screen (excluding installation, initial project management, and year 2/3 management software and tech support) was approximately $2,420 in 2010.
- Therefore, the US market added approximately 661,000 digital signs during 2010.
- According to IMS, the global market for digital signage infrastructure will reach $7 billion in 2013.
- Assuming the US retains the same percentage of market share, US spending on digital signage infrastructure will therefore rise to $2.24 billion in 2013.
- If, based on Edson's quote, the US installed base consisted of 2 million displays in 2010, the number of screens deployed each year will need to grow at a compound annual growth rate of around 21% in order to reach the target of 7 million displays by 2015:

- In other words, the 21% annual growth rate implies that the number of new screens deployed in the US will rise from 661,000 screens in 2010 to 1.17 million screens in 2013.
- Based on today's pricing, 1.17 million screens would cost $2.83 billion, which is 26% higher than the forecast market size.
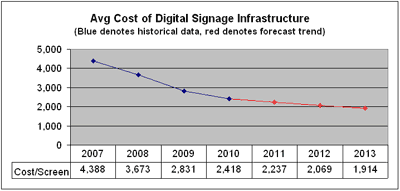
- To meet both the volume and revenue targets set by the above numbers, the average price per screen would need to drop to $1,915 in 2013 -- a 21% decrease from today's numbers.
- Such a cost decrease could be achieved with a compound annual price reduction of 7.5%, which is a very modest target according to our historical trends:

For starters, I wouldn't put too much faith in research report numbers, especially when multiple research firms produce such different values for both current market size and projected growth rates. Next, if past growth rates both domestically and globally are any indication, Edson's assertion that the US will add another 5 million screens in the next 5 years might actually be conservative, since it presumes only a 21% CAGR in the number of new deployments. There are plenty of indications that we might be able to sustain a rate of 25% or more over that period, in which case we may be looking at the addition of an even larger number of screens by mid-decade. And finally, we know that costs will continue to fall -- our 5+ years of pricing research establishes this clear trend. But again, the 7.5% annual decline necessary to meet the predicted growth rate and target revenue numbers may well be too low, suggesting that this next decade will see prices low enough to finally enable true mass adoption of digital signage systems.
Feel like prognosticating? Where will the industry be in 5 years? Do you believe the hype about growth rates and adoption? Leave a comment and let us know!


 Subscribe to the Digital Signage Insider RSS feed
Comments
RSS feed for comments to this post