Reading between the bubbles
When I originally put together the graphic below in 2008, it was for an article about the digital signage ecosystem, penned in response to a somewhat similar graphic from iSuppli. At the time, I thought our concept of the ecosystem might be unnecessarily complicated, but after a few more years in the business, I'm instead surprised by just how complicated things really are. Vendors with direct sales teams bid against channel partners on the same deals. Content creators turn into application developers but don't provide technical support. Installation companies manage procurement and handle accounts payable. And procurement companies buy and schedule content.
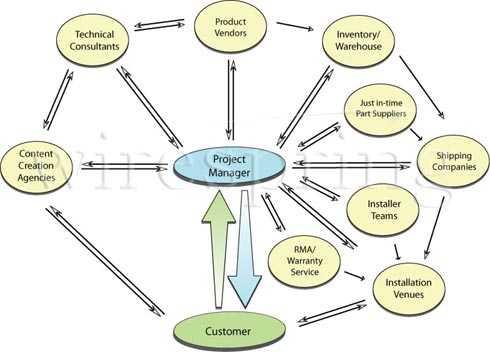
The ecosystem diagram circa 2008
Over time, I thought through these strange and complex relationships and tried to place various companies on my diagram. And then it occurred to me: the best places for innovation right now aren't the bubbles themselves, they're the spaces between the bubbles. Whereas companies in the digital signage industry tended to handle discrete lists of tasks, increased competition and economic pressure has left us all looking for ways to add more value to client relationships, and that often means straddling two or more bubbles in the ecosystem graphic. For example:
- Software Vendor + Technical Consultant + Project Manager = Full-Service Technical Solutions Provider. Ok, that one was pretty easy, since many software guys out there are willing to do custom development and project planning for a fee. What about...
- Warehousing + JIT Procurement + Shipping = Full-Service Supply-Chain Management. A bunch of small, midsize and even large distributors are already starting to offer this type of service, where you're not just buying from them, but they're managing the acquisition and distribution of products according to your schedule.
- And if you throw Financing into the above mix, you get yet another kind of entity -- one that can help you spread capital costs out (and hopefully match them up with revenue).
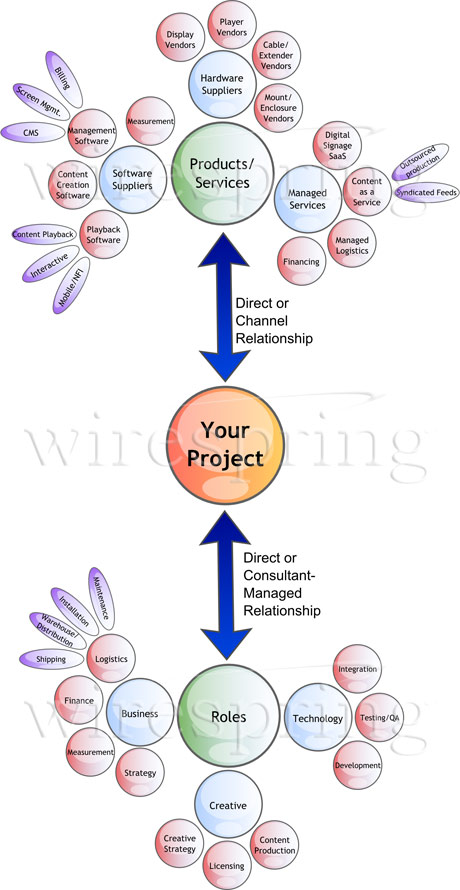
The updated ecosystem diagram for 2011
What does the new diagram tell us?
Essentially, there's room for two types of growth: horizontal and vertical. We touched on these concepts back in 2010, when we looked at horizontal and vertical integration as M&A strategies. In the context of the digital signage ecosystem, some examples of vertical growth could include:
- Creative Services + Content Syndication = Content-as-a-Service. We've actually seen a couple of these companies emerge recently, on top of old-timers like the AP and Reuters who produce and syndicate both "hard" and "soft" content to anyone willing to pay.
- CMS-as-a-Service + Content Strategy + Licensing = Curated Content Service. There's definitely a need in the marketplace for experts to "suggest" content to time-starved network managers who want their screens to stay fresh and look good.
- Business Strategy + Measurement + Analysis = Digital Signage Actuary. Admittedly, the title of this one is a bit lame. But anyone with the skills necessary to implement a measurement process, analyze the data, and generate meaningful strategic conclusions from them should have no trouble attracting customers.
- Tech Integration + Development + Content Creation = Full-Service Project Integration. Whether app development and content creation are in-housed or outsourced, integrators who can manage the entire project are in demand.
- Digital Signage SaaS + Content-as-a-Service = Turnkey Signage. Again, we've started to see vendors package content-as-a-service with their existing software offerings, so I think that trend will continue thanks to its great value to end-users, particularly those with little creative experience.
- Creative Strategy + Business Strategy = Super-Duper Gee Whiz Digital Signage Expert Consultant. Yup, we've got plenty of them already, but only a vanishingly small number of good ones.
What else would you add to the digital signage ecosystem diagram? Leave a comment and let us know!
 Subscribe to the Digital Signage Insider RSS feed
Comments
RSS feed for comments to this post