The key takeaways
Straight out of the document's introduction section comes this statement, sure to be used in business plans and VC pitches for some time to come:
Out-of-home advertising, in its many forms, has proven to be an effective way to reach busy consumers. Instead of relying on the medium to bring the consumer to the message, advertisers use OOH campaigns to put the message in the path of consumers as they go about their day. Digital video display networks take OOH advertising to the next level. They are designed to stand out in cluttered environments and engage shoppers at the moment when the buying decision is being made. In many cases, they are the "last voice" to influence consumers before the purchase event.Arbitron and their partner Edison Research conducted interviews and read media exposure diaries from nearly 1,700 participants to come to that conclusion. In doing so, they have given us a new degree of insight into the socioeconomic and demographic characteristics of the people who see digital signage networks. Remarkably, they found that "out-of-home digital video displays as media reach two-thirds (67%) of U.S. residents aged 18 or older each month," and of those, 76% noticed them at multiple venues. That last part is really interesting to me, because it's a number that I've often wondered about, but had never seen any research on. (Since none of my own clients have screens in multiple venue types, it's been impossible getting them to pony up for research on the subject.) Whereas digital screens could once count on novelty to guarantee a certain amount of visibility, that's definitely not the case any longer -- not that any of you would have suspected it was, of course.
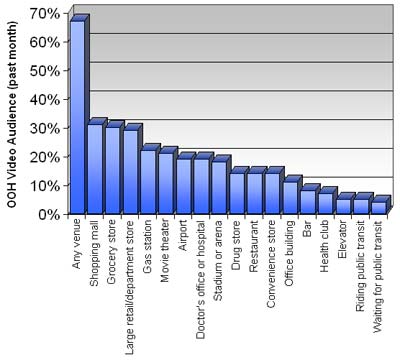
Here are the results organized by venue type:

So, over 155 million adults in the US notice at least one digital sign every month. They say they're most likely to see them in a shopping mall (31%), supermarket (30%) or large retail/department store (29%), but even smaller venues that drive less traffic show some eye-popping numbers. For example, drug stores, restaurants and convenience stores each grabbed about 14% of adult US eyeballs, for a total of nearly 100 million actual impressions each month.
Diving deeper into the demographics
Did you know that (according to this report, anyway):
- The typical digital sign viewer is 6% more likely to be male, when compared to the overall US adult population.
- The typical viewer is 25% more likely to be very young (18-24 years old), when compared to the overall US adult population.
- The majority of viewers have a household income of $25K-$75K.
Arbitron also provides detailed statistics for each venue type (e.g. supermarkets, transit hubs, doctor's offices, etc.) which do show some interesting -- but not unexpected -- demographic trends. Again, the information is useful and illustrative of what a "typical" network in each of these venues might look like, but offers no surprises. And that's a good thing.
How can we use this information?
Well, the simplest approach might be to turn the numbers on their heads: while 31% of respondents recall seeing a digital screen in a shopping mall, that means that 69% of people did not see screens there. Of course, there are several potential causes for this. First, not everybody goes to the mall at least once a month. However, the NIH estimates that (at least prior to the economic meltdown), 70% of Americans visit malls each week. So conservatively, there's another 40% of Americans who are in those venues but don't recall seeing screens. Second, not every mall has digital screens -- I know, I know, it's hard to believe. But I'm pretty sure that somewhere out there we could probably find a mall totally devoid of any kind of digital signage. I don't know what the percentage of digital signage haves to have-nots is. But again, it doesn't seem high enough to account for this massive disparity, since a difference of 40% equates to more than 90 million people each month. I'll leave the estimates for other types of venues as an exercise for you.
The Arbitron data can also be used to check against older published statistics. For example, Arbitron's study seems to confirm some of the data produced by Nielsen for Adspace Networks back in 2007. At the time, Nielsen indicated that 47% of all mall traffic saw the ads on at least one Adspace screen. Based on the aforementioned NIH estimate, this equates to about 33% of the US population. Arbitron's research says the number is 31%, which is pretty close, and almost certainly within the margin of error. Likewise, the Nielsen data indicated that women 18-34 and men 18-24 index highest among mall visitors, which is mostly in line with Arbitron's own findings.
No magic bullet
I know that a lot of people are waiting for some magic bullet to solve their ad sales and VC funding challenges. You know, a remarkable figure from a big research company or agency that will put to rest any lingering doubts over our medium's viability as a communication channel. Unfortunately, the Arbitron Out-of-Home Digital Video Display Study 2009 is not it. But it's still solid research from a reputable firm that specializes in dissecting media exposure. And no matter how you read it, it's clear that digital signs have a pretty serious penetration rate -- reaching two-thirds of the adults in the US every single month. So if you haven't looked over the Arbitron study yet, I encourage you to take a few minutes and check it out.
Were there any hidden surprises that I missed in this report? Did the findings provide you with some useful insight that will help you and your business? Leave a comment below and let us know!

 Subscribe to the Digital Signage Insider RSS feed
Comments
RSS feed for comments to this post