Experimental controls
We knew from other industries that computer simulations could sometimes be used to predict real-world behavior. But it's a lot easier to accidentally make a test that has no relation to the real-world than it is to make one that genuinely reflects how things work.
So, before we got started we knew that we had to somehow calibrate our own tests to the real-world research results we've gathered over the past few years. We came up with the following goals that would help us determine whether a simulation was good enough for general use:
- Allows us to calibrate answers as well as verify experimental validity
- Baseline results are from real-world research in retail stores
- Correlation of over 90% is considered "good enough"
We ran several batches of test images through Mechanical Turk until the results from MT were similar enough to real-world tests of the same variables (based on exit interviews done by our clients in the past).
We started with screen awareness. In the past, our clients had used exit interview questions to see if viewers were aware of in-store screens. These typically took the form of "did you notice a screen showing content in the store?" or "what kinds of advertising did you notice in the store?" Lots of companies have asked these questions before, so we had good baseline data to work with. In the field, about 80 to 90% of respondents answered "correctly" that there was a screen. Our target was 85%. In reality, we achieved a 95% correct response rate.
We then moved on to what we called message awareness. Real-world exit interview questions that check for awareness might have been "did you notice an advertisement for a particular product", or something similar. Unfortunately, real world results for these questions were all over the place, probably due to differences in survey methods and quality of the networks being tested themselves, so this was a hard test for us to qualify. We eventually decided to aim for the middle of the range, targeting a 60% correct answer rate. After some tweaking we got 70% and deemed it good enough to continue.
Finally, we tested message recall -- for example, "can you recall what the in-store TV commercial for Charmin was about?" In the real world, these questions score lowest, with a decent result in the 24-40% correct range. Our target was 35%. We achieved 55%.
At this point, I should mention that a higher result actually means that our simulation was too "easy", so it doesn't match real-world examples as closely as we'd like. But after lots of tweaking and changes, we found that it was difficult to get much closer to the real world results without adding a lot of artificial difficulties. So with our system calibrated against these three controls, we moved on to running our experimental tests, which contained a few more controls as well as the new variables that we hoped to gain some insight on.
Setting up the tests
For time and cost sake, we decided to begin our tests using still images, not videos. Based on the control tests we had just conducted, we found that we needed to make certain modifications to our test images to get accurate and consistent results. Here's an example:
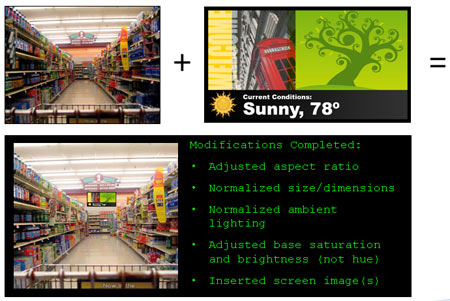
This hypothetical example started with a clean photo taken in a target venue. We then took the content to be tested (I'm just using this simple piece with some weather information as an example), and merged the two together. We adjusted the aspect ratio of the screen and normalized its dimensions to fit the perspective that the photo was taken from. We also did some slight tweaking to normalize the lighting: since we wanted to test ambient lighting as one of our variables, we'd need to establish a baseline. Finally, we made the base saturation and brightness levels for the image the same as all the other images in our test list.
Once we had a collection of about 100 test images together, we realized we needed some kind of framework to show them in. Since we'd be conducting these tests on the web, and workers might have any number of combinations of screen sizes, computer/Internet speeds, etc. we wanted a way to control as many of those additional variables as possible.
We ultimately wound up creating our own web-based test framework in JavaScript and HTML to handle a lot of these variables, and simply linked it into our Mechanical Turk job list. We made each "job" consist of a review of a dozen images, each of which was timed to show for only a fraction of a second, simulating the kind of "glance" that a viewer might give a screen for just an instant as he navigates around the venue. We also discarded the results of the first two images, figuring that during the first two views, workers would be adjusting to the job and the view/question/answer process.
We tried to run each test about 100 times, giving us a total of 1,000 data points to work with after discarding the first couple from each test. We ran ten permutations of our test, yielding just over 10,000 total usable data points when all was said and done. Total cost (excluding the work it took to get it all set up): about $200.
Next week: The tests and results -- I promise!
I know, I know, this article was another big tease. Don't worry, though. Next week, there'll be no more stalling, and we'll finally get to the seven variables we tested, the results we got, and some key takeaways from the whole process. Stay tuned!
 Subscribe to the Digital Signage Insider RSS feed